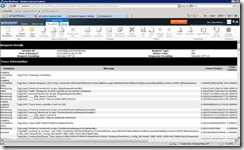
What is Developer dashboard?
Developer dashboard is a feature that allows you as a developer or an administrator to view trace information about the current request.
What can I use it for?
To debug the current SharePoint request and get an overview of where the pain-point on the request is.
How to turn developer dashboard on?
Turn developer dashboard always on: stsadm -o setproperty -pn developer-dashboard -pv on
Turn developer dashboard ondemand (click on the icon): stsadm -o setproperty -pn developer-dashboard -pv ondemand
Turn off developer dashboard: stsadm -o setproperty -pn developer-dashboard -pv off
Walkthrough:
Turn on developer dashboard ondemand by running "stsadm -o setproperty -pn developer-dashboard -pv ondemand"
Go to you site and on the top right corner the developer dash icon is showed, click on it
Then the site is finish loading go to the bottom of the screen and there you see the developer dashboard output.
In the left on the screen a quick trace information is showed and on the right is information about the web server and database requests.
If you click on a database request a popup window comes up with information about the query and the callstack.
By clicking on the quick trace information link a more detailed view of the trace is showed on the right site. E.g. The parse CAML query or the specific database request.
At the button of the developer dashboard is there a link "Show or hide additional tracing information . . ." this link will show the full asp.net trace view.


No comments:
Post a Comment